
Quick action is crucial for a reliable energy supply. But how do you react when wear damage, or sabotage occur unexpectedly? It is impossible for your technicians to monitor all assets around the clock—especially in increasingly complex, decentralized grids with renewable energies.
This is where AI makes the difference: it is your digital guardian that immediately detects anomalies. With this transparent data, you can initiate targeted maintenance measures before issues becomes critical. This ensures grid stability and the high level of service quality your customers demand.
Mastering challenges
Power grids are under increasing pressure. Decentralized and volatile energy sources, such as photovoltaic and wind power plants, are fundamentally transforming grid operations. At the same time, the threat of cyberattacks on grid operators continues to rise. These trends significantly increase operational complexity and make close, continuous real-time monitoring of operating resources indispensable.
AI-supported anomaly detection for secure grid operation
We have developed an AI-based solution to create the necessary transparency in grid operation and detect faults at an early stage. The objective of PSIdetect is to continuously monitor measured values from the control system and identify deviations from normal operating behavior—known as anomalies—at an early stage. In doing so, PSI enhances traditional monitoring systems, which are predominantly based on static threshold values, to include intelligent analysis of complex interdependencies and dynamic behavior patterns.
AI-supported analysis of electrical measurement data
PSIdetect uses artificial intelligence based on PSIqualicision AI to analyze large volumes of electrical measurement and process data from the control system. Both historical and current operating and weather data are used for training and comparison. Based on this information, the system continuously calculates a dynamic target state for the grid and reliably detects deviations.
Through autonomous training, the system learns to distinguish between normal and abnormal system states. In real-time operation, current measurement data is continuously analyzed and evaluated using an anomaly score. If this score exceeds a defined threshold, an anomaly is detected. This enables grid operators to identify potential faults early and initiate targeted countermeasures before critical situations arise.
Framework conditions
In order to reliably detect different types of deviations and provide targeted options for action, two complementary detection algorithms are used in combination.
Two detection approaches for maximum significance
1. Approach | Physical evaluation
Condition analysis
The physical condition assessment analyzes the state of an asset based on all measured data assigned to it. For example, in the case of a transformer, this could include current and voltage measurements as well as external and oil temperatures.
Evalutation of measurement data
The training data is used to establish stochastic relationships between measured values, resulting in a probability distribution that is evaluated in real-time operation. If one or more measured values fall outside the expected range, the system detects an anomaly. For example, the system can determine when a transformer*) heats up unusually under comparable load and ambient temperature conditions – a potential indication of incipient aging.
*) This is just one example - the same approach can be used for other assets, using their relevant measured values to reliably detect anomalies.
2. Approach | Pattern and trend recognition
Pattern and trend recognition evaluates the temporal behavior of measured values. Typically, variables such as temperatures, power outputs, or voltages follow known patterns and characteristic volatility. If this temporal behavior deviates significantly—for example, due to unusually strong fluctuations or conspicuous static behavior, it is identified as an anomaly.
Example: a gradual or significant drop in power of a single string in a photovoltaic system.
Transparent visualization and flexible configuration
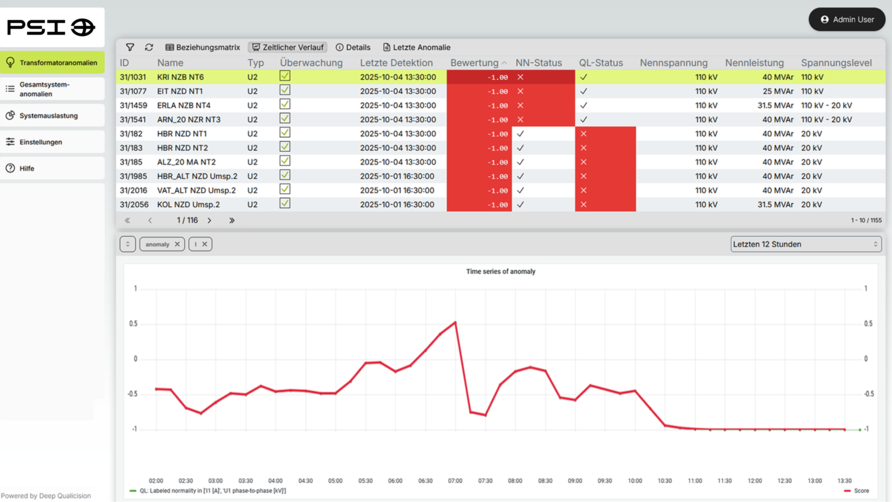
An anomaly score is automatically calculated from the analyzed data and clearly visualized using a traffic light display. A central dashboard provides a compact overview of currently detected anomalies, system utilization, and the status of data connections.
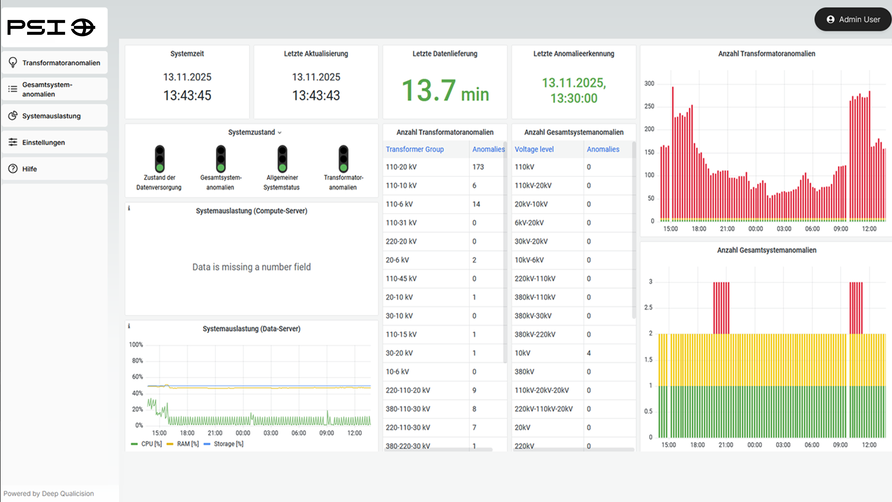
Tabular views provide detailed analyses, allowing individual anomalies to be examined. The anomaly score can be broken down into its components, making the reasons for the assessment transparent and easy to understand. In addition, the underlying time series of the measured values can be visualized.
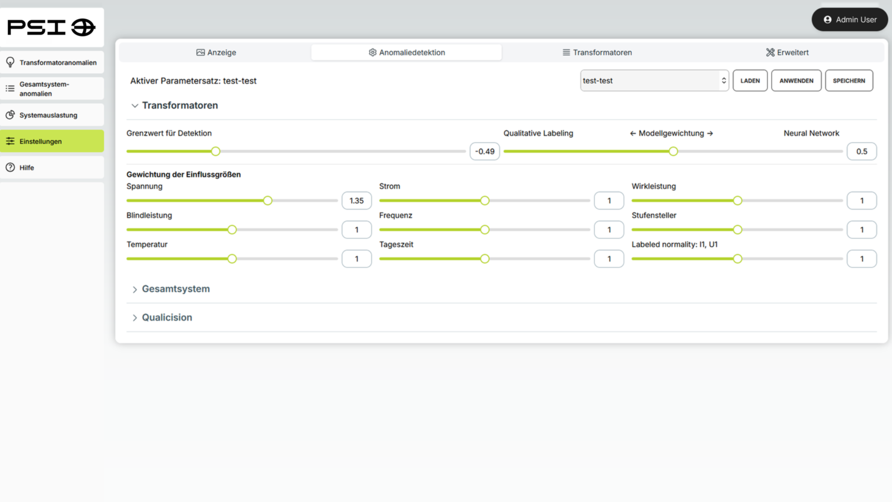
Both the sensitivity of anomaly detection and the AI training cycles can be configured individually. This is particularly useful after grid upgrades or when connecting large new feeders, such as extensive photovoltaic systems. By specifically adjusting the sensitivity, the detection algorithm can be optimally adapted to the respective grid conditions, further increasing detection accuracy.
Benefits of the workflow
-
Early detection
-
Accurate evaluation
-
Act in a timely manner
Conclusion: Full transparency
With PSIdetect, you as a grid operator not only gain a powerful tool for the early detection of anomalies but also the necessary transparency for reliable decision-making. This provides the basis for operating networks reliably, efficiently, and securely, enabling you to achieve high network quality in an increasingly dynamic energy landscape.